Practical 1-far 161-finish 1916f
This document was ed by and they confirmed that they have the permission to share it. If you are author or own the copyright of this book, please report to us by using this report form. Report 445h4w
Overview 1s532p
& View Practical 1-far 161-finish as PDF for free.
More details 6h715l
- Words: 2,122
- Pages: 10
c
FAR 161/2
Basic Pharmacology and Immunopharmacology PRACTICAL 1
ISOLATED GUINEA-PIG ILEUM: AGONIST DOSE-RESPONSE CURVE
NAME
: ZULKIFLI BIN KHAIRUDDIN
MATRIC NO. : 107225 I/C NO.
: 910304-08-6409
GROUP
:B
OBJECTIVE: To study contractile responses of ileal segments isolated from a guinea-pig with increasing doses of acetylcholine (ACh).
INTRODUCTION: Guinea-pig isolated ileum One of the basic principles of pharmacology holds that, within certain limits, the response of a tissue organ to a drug is related in magnitude to the concentration of the drug in region of the receptor with which it combines. To test and examine further this principle, a preparation which is amenable to the recording of a range of magnitudes of response is required. Thus, the isolated ileum of the guinea-pig is the most suitable preparation for this purpose, since it lacks spontaneous activity (unlike ileal segments isolated from rabbits) when put under favourable conditions (temperature approximately 32oC or room temperature, 1 gram (10mN) tension, in Tyrode solution which is aerated with 95% O2 & 5% CO2). These factors are vital to ensure that the effect of increasing drug concentration on contraction of the isolated guinea-pig ileum is measured accurately. In addition, guinea-pig ileal segments are robust and therefore able to respond to drugs for a few hours › › Agonist dose-response curves Dose and response are related and can be represented by a dose-response curve. Data from toxicology testing can be represented by a dose-response curve, from which scientists can describe the threshold and potency of chemicals.
The response to a drug may be: 1.c Graded ± these responses can be measured, eg: tissue contractile responses 2.c Quantal ± this type of response is either present or not at all (³all or none´) eg: death, recovery, sleep
The responses in this experiment is graded. Graded dose-response relationship can be used to determine maximum efficacy of a drug. Dose-response curves can be used to plot the results of many kinds of experiments. The X-axis plots concentration of a drug or hormone. The Y-axis plots response, which could be almost anything. For example, the response might be enzyme activity, accumulation of an intracellular second messenger, membrane potential, secretion of a hormone, heart rate or contraction of a muscle. The term "dose" is often used loosely. The term "dose" strictly only applies to experiments performed with animals or people, where you ister various doses of drug. You don't know the actual concentration of drug -- you know the dose you istered. However, the term "dose-response curve" is also used more loosely to describe › › experiments where you apply known concentrations of drugs. The term "concentration-response curve" is a more precise label for the results of these experiments.
METHOD: Refer the Pharmacology Practical Manual (page 3-7)
RESULTS: i)c
Investigation of the relationship between the dose of ACh and its contractile response in isolated segments of guinea-pig ileum
Dose of Ach (µg) 1.0 2.0 4.0 8.0 16.0 24.0 32.0
Log dose ACh 0 0.3 0.6 0.9 1.2 1.4 1.5
Threshold dose = 2.0 ug Maximum dose = 24.0 ug
Contractile response(cm) 0.00 0.30 0.50 1.30 1.70 2.00 2.00
% of Emax 0.00 15.00 25.00 65.00 85.00 100.00 100.00
ii)c
Investigation of the variation in contractile responses observed in segments of isolated guinea-pig ileum, with repetition of a single dose of ACh. c
Our group did not have time to do this experiment. Thus, we took our friends¶ result for this experiment. The concentration that they took is as the concentration ACh will give response about 50% Emax.
Readings 1 2 3 4 5 6 7 8 9 10 Mean magnitude of contractile response = 1.4 + 1.2 + 1.1 + 1.4 + 1.5 + 1.3+ 1.7 + 1.6 + 2.0 + 2.1 10 = 1.33
Smallest magnitude = 1.1 cm Largest magnitude = 2.1 cm
Responses (cm) 1.4 1.2 1.1 1.4 1.3 1.5 1.7 1.6 2.0 2.1
iii)c
Responses and percentage of maximum responses to increasing doses of acetylcholine in the presence of atropine (1.00x10l M)
Acetylcholine concentration 2.00x10 4.00x10 8.00x10 1.6x10 3.20x10 6.4X10 1.28X10 2.56X10 5.12X10 1.02X10 2.05X10 4.10X10 8.20X10
Response(cm) 0.00 0.00 0.00 0.00 0.50 1.20 3.50 6.00 8.30 12.10 12.90 14.10 15.00
% of Emax 0.00 0.00 0.00 0.00 3.33 8.00 23.33 40.00 53.33 80.67 86.00 94.00 100.00
c c iv)c
Responses and percentage of maximum responses to increasing doses of acetylcholine in the presence of papaverine (1.00x10lM)
Acetylcholine concentration 2.00x10 4.00x10 8.00x10 1.6x10 3.20x10 6.4X10 1.28X10 2.56X10 5.12X10 1.02X10 2.05X10 4.10X10 8.20X10
Response(cm) 0.00 0.00 1.00 2.20 4.30 5.80 7.00 8.60 9.80 10.10 10.10 10.10 10.10
% of Emax 0.00 0.00 6.67 14.67 28.67 38.67 46.67 57.33 65.33 67.33 67.33 67.33 67.33
XUESTIONS:
1.c Investigation of the relationship between the dose of ACh and its contractile response in isolated segments of guinea-pig ileum. m c › m › m m m› › m› From the experiment, increasing the dose of the drug will increase the contractile response in guinea-pig ileum. The drug use in this experiment is Acetylcholine (ACh). The threshold dose is 2.0 µg and the maximum dose is 24.0 µg. As a conclusion, increasing the dose will increase the contractile response of the guinea-pig ileum. The contractile response will reach the maximum response. So, increasing the dose of the drug will make the response is constant. This is regarding to the limited receptor.
2.c Investigation of the variation in the contractile response observed in segments of isolated guinea-pig ileum, with repetition of a single dose of ACh. m c m m›m› › m m
hen the same concentration of the drug is injected repeatedly and continually, we found that the magnitude of contractile response is increasing and then decreasing. This is because tachyphylaxis occurs. Tachyphylaxis is the phenomenon that explains about the less sensitivity of the receptor towards the drug because the drug is repeatedly and continually be given in the long period of time. In this experiment, when we repeatedly inject the drug into the Tyrode solution, the magnitude of the contraction response will decrease.
c m › m › m› › mm › m › m› › › › ›m › m ›› mm›
Two methods can be applied in order to determine the unknown concentration of ACh, by using isolated guinea-pig ileum preparation. There are : i ) Graph method The same method as the experiment before is applied to the guinea-pig ileum and the dose use is the unknown concentration of ACh. Drug is injected and the contractile response of guinea-pig ileum is measured by using the kymograph trace. From the previous experiment, known that the maximum response is 2.0cm. Let say the response obtained from the unknown concentration of ACh is x cm. So, the percentage of the maximum response for unknown concentration of ACh can be calculated with the following formula.
% maximum response = E
X 100%
Emax
% maximum response = x
X 100%
2.0 From the graph percentage maximum response against log-dose of ACh, extrapolate the x-axis that give the percentage response. The value from the x-axis is the value of log dose for unknown concentration of ACh. hen the value is antilog, the unknown concentration of ACh can be known in µg. ii ) Estimation method This method is not very accurate because the result obtained is only an estimation and not specific. This method can be done only on qualitative not quantitative. Drug with concentration 0.5 µg is assume as known concentration of ACh. It is use in the organ bath which contains isolated guinea-pig ileum. Kymograph pen is trace on the graph paper as responds to the contractile response of isolated guinea-pig ileum. The kymograph trace for the contractile response is measured and jotted down on the paper. Rinse the organ bath and ileum twice using the Tyrode solution in 2 minutes. Then, the unknown concentration of ACh is injected in the organ bath. The kymograph trace for the contractile response of unknown concentration of ACh is measure and compare with the 0.5 µg concentration of ACh. If the response obtained from the unknown concentration of ACh is higher than known concentration of ACh, it can be conclude its concentration is more than 0.5 µg and vice versa. This method is not encouraged to be use because the percentage of error to occur is high.
DISCUSSION: Agonists are drugs or ligands that bind to the same active site of receptor with endogenous ligand that caused the same signals. The magnitude signals of agonists either the same or less than the magnitude signals of endogenous ligand. The linear response when the log concentration of agonists formed when agonists added to the biological system. Acetylcholine is agonists that have high affinity towards cholinergic receptor. The isolated guinea-pig ileum can contract faster when presence of acetylcholine. Atropine is competitive antagonists. hen the solution that contain isolated guinea-pig ileum and acetylcholine added with atropine, the response obtained is below than the solution isolated guinea-pig ileum and acetylcholine without atropine. It is because agonist will competed with antagonist to bind at the same site of receptor. Antagonists will prevent the agonists to bind and also will prevent the contraction of isolated guinea-pig ileum. But, when we replace the atropine with papaverine, the effect of response is below than the presence of atropine. It is because papaverine is irreversible antagonist. Irreversible antagonist will bind to the active site of receptor, it will not detach from the receptor. It is contrast than atropine because atropine will detach from the receptor, thus, agonists can bind to the receptor after that. The differences between atropine and papaverine can be shown at the graph. |c ›m› m› ›
m › m› › ›m › m ›› c c In this experiment, it is shown that the concentration of drug is parallel to the response of isolated guinea-pig. Its mean that when the concentration of the drug is increase, the contractile response in isolated segment of guinea-pig ileum also increase. This is because the empty receptor will bind with the drug continuously. The more concentration of drug, more the drug can bind with the receptor and contribute high response. c ?c ›m› m›m› › m› › ›m › m ›› › ›› m› c Drug at the same concentration that inject repeatedly and continually will cause the receptor less response towards the drug. This is known as tachyphylaxis. Therefore when a dose of ACh which give a response of 50% Emax is repeatedly injected in the organ bath, the magnitude of the response is decrease. It is because its receptor less response toward the ACh. c
PRECAUTIONS: 2c Make sure hand is washed thoroughly before handling the ileum. 2c Ensure that both thread and ileal segment are never in with the walls of the organ bath chamber. 2c Make sure accurate volume of solution is measured while preparing the serial dilution. 2c Make sure that the ileal segment is always completely immersed in Tyrode solution 2c Hold the ileum by using the hands, not using the forceps. It is because to prevent the ileum to damage. 2c Make sure the speed rate of kymograph is around 2 or 3. 2c Make sure the tyrode solution in the organ bath will changed every 3 minutes.
CONCLUSION: c From the experiment, we had study the contractile responses of ileal segments isolated from a guinea-pig ileum to increasing doses of ACh. The threshold dose is 2.0 µg and the maximum dose is 24.0 µg. Increase the dose of ACh will increase the magnitude of contractile response. The magnitude of contractile response will increase until reach the maximum response.
hen the same dose of ACh is repeatedly and continually injected to the Tyrode solution the magnitude of contractile response of ileal is decrease with time. This is because phenomenon known as tachyphylaxis occurs.
REFERENCES: Vc Pharmacology Practical Manual Vc Notes lectures pharmacology. (Introduction to Pharmacology & Mechanisms Drug Action) Vc Dorland¶s Pocket Medical Dictionary 27th edition
Related Documents 2w1qw

Practical 632c2x
August 2020 0
Practical Falconry.pdf ju4r
December 2019 36
Practical Slips 16491r
December 2021 0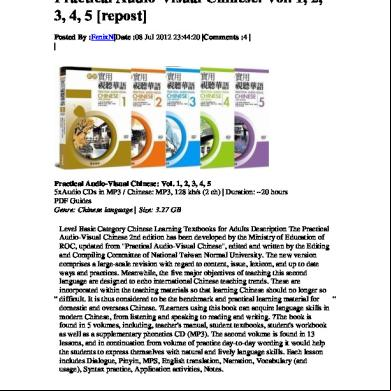
Practical Audio 3182k
January 2022 0
Practical List 3d6c1o
December 2021 0
Practical Physiology 1m1v4o
January 2022 0More Documents from "Zulkifli Khairuddin" 4c2s4

Practical 1-far 161-finish 1916f
December 2019 21
358310631 Sk Pejabat Pengelola Blud Rsud Panyabungan 5m565x
July 2020 0
Pps Pokja Ppi 2019 4a1z43
October 2020 0
Pedoman Penilaian Kinerja Puskesmas 2h2i24
October 2020 0
Kedudukan Dan Fungsi Bahasa Indonesia 2j131m
December 2019 66