Turban Ch1 Ch6 5c5p2b
This document was ed by and they confirmed that they have the permission to share it. If you are author or own the copyright of this book, please report to us by using this report form. Report 445h4w
Overview 1s532p
& View Turban Ch1 Ch6 as PDF for free.
More details 6h715l
- Words: 9,811
- Pages: 167
Business Intelligence: A Managerial Approach nd (2 Edition) Chapter 1: Introduction to Business Intelligence
Business Pressures–Responses– Model
1-2
Copyright © 2011 Pearson Education, Inc. Publishing as Prentice Hall
Business Environment Factors FACTOR Markets
Consumer demand Technology
Societal
1-3
DESCRIPTION Strong competition Expanding global markets Blooming electronic markets on the Internet Innovative marketing methods Opportunities for outsourcing with IT Need for real-time, on-demand transactions Desire for customization Desire for quality, diversity of products, and speed of delivery Customers getting powerful and less loyal More innovations, new products, and new services Increasing obsolescence rate Increasing information overload Social networking, Web 2.0 and beyond Growing government regulations and deregulation Workforce more diversified, older, and composed of more women Prime concerns of homeland security and terrorist attacks Necessity of Sarbanes-Oxley Act and other reporting-related legislation Increasing social responsibility of companies Greater emphasis on sustainability
Copyright © 2011 Pearson Education, Inc. Publishing as Prentice Hall
Organizational Responses
Be Reactive, Anticipative, Adaptive, and Proactive Managers may take actions, such as:
1-4
Employing strategic planning. Using new and innovative business models. Restructuring business processes. Participating in business alliances. Improving corporate information systems. Improving partnership relationships. Encouraging innovation and creativity. …cont…>
Copyright © 2011 Pearson Education, Inc. Publishing as Prentice Hall
Organizational Responses, continued
1-5
Improving customer service and relationships. Moving to electronic commerce (e-commerce). Moving to make-to-order production and ondemand manufacturing and services. Using new IT to improve communication, data access (discovery of information), and collaboration. Responding quickly to competitors' actions (e.g., in pricing, promotions, new products and services). Automating many tasks of white-collar employees. Automating certain decision processes. Improving decision making by employing analytics.
Copyright © 2011 Pearson Education, Inc. Publishing as Prentice Hall
Business Intelligence (BI)
BI is an evolution of decision concepts over time.
Meaning of EIS/DSS…
1-6
Then: Executive Information System Now: Everybody’s Information System (BI)
BI systems are enhanced with additional visualizations, alerts, and performance measurement capabilities. The term BI emerged from industry apps.
Copyright © 2011 Pearson Education, Inc. Publishing as Prentice Hall
Definition of BI
1-7
BI is an umbrella term that combines architectures, tools, databases, analytical tools, applications, and methodologies. BI a content-free expression, so it means different things to different people. BI's major objective is to enable easy access to data (and models) to provide business managers with the ability to conduct analysis. BI helps transform data, to information (and knowledge), to decisions and finally to action.
Copyright © 2011 Pearson Education, Inc. Publishing as Prentice Hall
The Architecture of BI
A BI system has four major components:
1-8
a data warehouse, with its source data business analytics, a collection of tools for manipulating, mining, and analyzing the data in the data warehouse; business performance management (BPM) for monitoring and analyzing performance a interface (e.g., dashboard)
Copyright © 2011 Pearson Education, Inc. Publishing as Prentice Hall
A High-level Architecture of BI
1-9
Copyright © 2011 Pearson Education, Inc. Publishing as Prentice Hall
Components in a BI Architecture
The data warehouse is the cornerstone of any medium-to-large BI system.
Originally, the data warehouse included only historical data that was organized and summarized, so end s could easily view or manipulate it. Today, some data warehouses include access to current data as well, so they can provide real-time decision (for details see Chapter 2).
Business analytics are the tools that help s transform data into knowledge (e.g., queries, data/text mining tools, etc.).
1-10
Copyright © 2011 Pearson Education, Inc. Publishing as Prentice Hall
Styles of BI
MicroStrategy, Corp. distinguishes five styles of BI and offers tools for each: 1. 2. 3. 4. 5.
1-11
report delivery and alerting enterprise reporting (using dashboards and scorecards) cube analysis (also known as slice-anddice analysis) ad-hoc queries statistics and data mining
Copyright © 2011 Pearson Education, Inc. Publishing as Prentice Hall
The Benefits of BI
The ability to provide accurate information when needed, including a real-time view of the corporate performance and its parts A survey by Thompson (2004)
1-12
Faster, more accurate reporting (81%) Improved decision making (78%) Improved customer service (56%) Increased revenue (49%)
See Table 1.2 for a list of BI analytic applications, the business questions they answer and the business value they bring.
Copyright © 2011 Pearson Education, Inc. Publishing as Prentice Hall
Intelligence Creation and Use A Cyclical Process of Intelligence Creation And Use BI practitioners often follow the national security model depicted in this figure.
1-13
Copyright © 2011 Pearson Education, Inc. Publishing as Prentice Hall
Intelligence Creation and Use
Steps Involved
Data warehouse deployment Creation of intelligence
Identification and prioritization of BI projects
BI Governance
Who should do the prioritization?
1-14
By using ROI and TCO (cost-benefit analysis) This process is also called BI governance
Partnership between functional area heads Partnership between customers and providers
Copyright © 2011 Pearson Education, Inc. Publishing as Prentice Hall
BI Governance Issues/Tasks 1.
2. 3. 4. 5. 1-15
Create categories of projects (investment, business opportunity, strategic, mandatory, etc.) Define criteria for project selection Determine and set a framework for managing project risk Manage and leverage project interdependencies Continuously monitor and adjust the composition of the portfolio
Copyright © 2011 Pearson Education, Inc. Publishing as Prentice Hall
Intelligence and Espionage
Stealing corporate secrets, CIA, …
Intelligence vs. Espionage
Intelligence The way that modern companies ethically and legally organize themselves to glean as much as they can from their customers, their business environment, their stakeholders, their business processes, their competitors, and other such sources of potentially valuable information
Problem – too much data, very little value
1-16
Use of data/text/Web mining (see Chapter 4, 5)
Copyright © 2011 Pearson Education, Inc. Publishing as Prentice Hall
Transaction Processing Versus Analytic Processing
Transaction processing systems are constantly involved in handling updates (add/edit/delete) to what we might call operational databases.
1-17
ATM withdrawal transaction, sales order entry via an ecommerce site – updates DBs Online analytic processing (OLTP) handles routine on-going business ERP, SCM, CRM systems generate and store data in OLTP systems The main goal is to have high efficiency
Copyright © 2011 Pearson Education, Inc. Publishing as Prentice Hall
Transaction Processing Versus Analytic Processing
Online analytic processing (OLAP) systems are involved in extracting information from data stored by OLTP systems
1-18
Routine sales reports by product, by region, by sales person, etc. Often built on top of a data warehouse where the data is not transactional Main goal is effectiveness (and then, efficiency) – provide correct information in a timely manner More on OLAP will be covered in Chapter 2
Copyright © 2011 Pearson Education, Inc. Publishing as Prentice Hall
BI and Business Strategy
To be successful, BI must be aligned with the company’s business strategy.
BI changes the way a company conducts business by
1-19
BI cannot/should not be a technical exercise for the information systems department.
improving business processes, and transforming decision making to a more data/fact/information driven activity.
BI should help execute the business strategy and not be an impediment for it!
Copyright © 2011 Pearson Education, Inc. Publishing as Prentice Hall
Real-time, On-demand BI
The demand for “real-time” BI is growing! Is “real-time” BI attainable? Technology is getting there…
1-20
Automated, faster data collection (RFID, sensors,… ) Database and other software technologies (agent, SOA, …) are advancing Telecommunication infrastructure is improving Computational power is increasing while the cost for these technologies is decreasing
Trent -> Business Activity Management
Copyright © 2011 Pearson Education, Inc. Publishing as Prentice Hall
Issues for Successful BI
Developing vs. Acquiring BI systems
Developing everything from scratch Buying/leasing a complete system Using a shell BI system and customizing it Use of outside consultants?
Justifying via cost-benefit analysis
It is easier to quantify costs Harder to quantify benefits
1-21
Most of them are intangibles
Copyright © 2011 Pearson Education, Inc. Publishing as Prentice Hall
Issues for Successful BI
Security and Privacy
Still an important research topic in BI How much security/privacy?
Integration of Systems and Applications
BI must integrate into the existing IS
Integration to outside (partners of the extended enterprise) via internet –
1-22
Often sits on top of ERP, SCM, CRM systems
customers, vendors, government agencies, etc.
Copyright © 2011 Pearson Education, Inc. Publishing as Prentice Hall
Major BI Tools and Techniques
Tool categories
1-23
Data management Reporting, status tracking Visualization Strategy and performance management Business analytics Social networking & Web 2.0 New/advanced tools/techniques to handle massive data sets for knowledge discovery
Copyright © 2011 Pearson Education, Inc. Publishing as Prentice Hall
Business Intelligence: A Managerial Approach nd (2 Edition) Chapter 2: Data Warehousing
What is a Data Warehouse?
1-25
A physical repository where relational data are specially organized to provide enterprisewide, cleansed data in a standardized format “The data warehouse is a collection of integrated, subject-oriented databases designed to DSS functions, where each unit of data is non-volatile and relevant to some moment in time”
Copyright © 2011 Pearson Education, Inc. Publishing as Prentice Hall
Characteristics of DW 1-26
Subject oriented Integrated Time-variant (time series) Nonvolatile Summarized Not normalized Metadata Web based, relational/multi-dimensional Client/server Real-time and/or right-time (active)
Copyright © 2011 Pearson Education, Inc. Publishing as Prentice Hall
Data Mart A departmental data warehouse that stores only relevant data
1-27
Dependent data mart A subset that is created directly from a data warehouse Independent data mart A small data warehouse designed for a strategic business unit or a department
Copyright © 2011 Pearson Education, Inc. Publishing as Prentice Hall
Data Warehousing Definitions
1-28
Operational data stores (ODS) A type of database often used as an interim area for a data warehouse Oper marts An operational data mart Enterprise data warehouse (EDW) A data warehouse for the enterprise Metadata Data about data. In a data warehouse, metadata describe the contents of a data warehouse and the manner of its acquisition and use
Copyright © 2011 Pearson Education, Inc. Publishing as Prentice Hall
DW Framework No data marts option Applications (Visualization)
Data Sources Access ERP
ETL Process
Data mart (Marketing)
Select Legacy
Metadata Extract
POS
Transform
Enterprise Data warehouse
Integrate Other OLTP/wEB
Data mart (Finance)
Load Replication
External data
1-29
Data mart (Engineering)
Data mart (...)
Copyright © 2011 Pearson Education, Inc. Publishing as Prentice Hall
Routine Business Reporting
Data/text mining
OLAP, Dashboard, Web
Custom built applications
DW Architecture
Three-tier architecture 1. 2.
3.
Data acquisition software (back-end) The data warehouse that contains the data & software Client (front-end) software that allows s to access and analyze data from the warehouse
Two-tier architecture First 2 tiers in three-tier architecture is combined into one
Sometimes there is only one tier 1-30
Copyright © 2011 Pearson Education, Inc. Publishing as Prentice Hall
DW Architectures
Tier 1: Client workstation
1-31
Tier 2: Application & database server
Copyright © 2011 Pearson Education, Inc. Publishing as Prentice Hall
A Web-based DW Architecture
1-32
Copyright © 2011 Pearson Education, Inc. Publishing as Prentice Hall
Teradata Corp. DW Architecture
1-33
Copyright © 2011 Pearson Education, Inc. Publishing as Prentice Hall
Data Warehousing Architectures Ten factors that potentially affect the architecture selection decision: 1. Information interdependence between organizational units 2. Upper management’s information needs 3. Urgency of need for a data warehouse 4. Nature of end- tasks 5. Constraints on resources 1-34
6. Strategic view of the data warehouse prior to implementation 7. Compatibility with existing systems 8. Perceived ability of the in-house IT staff 9. Technical issues 10. Social/political factors
Copyright © 2011 Pearson Education, Inc. Publishing as Prentice Hall
Data Integration and the Extraction, Transformation, and Load (ETL) Process Extraction, transformation, and load (ETL)
1-35
Copyright © 2011 Pearson Education, Inc. Publishing as Prentice Hall
Representation of Data in DW
Dimensional Modeling – a retrieval-based system that s high-volume query access Star schema – the most commonly used and the simplest style of dimensional modeling
1-36
Contain a fact table surrounded by and connected to several dimension tables Fact table contains the descriptive attributes (numerical values) needed to perform decision analysis and query reporting Dimension tables contain classification and aggregation information about the values in the fact table
Snowflakes schema – an extension of star schema where the diagram resembles a snowflake in shape
Copyright © 2011 Pearson Education, Inc. Publishing as Prentice Hall
Multidimensionality
Multidimensionality The ability to organize, present, and analyze data by several dimensions, such as sales by region, by product, by salesperson, and by time (four dimensions)
Multidimensional presentation
1-37
Dimensions: products, salespeople, market segments, business units, geographical locations, distribution channels, country, or industry Measures: money, sales volume, head count, inventory profit, actual versus forecast Time: daily, weekly, monthly, quarterly, or yearly
Copyright © 2011 Pearson Education, Inc. Publishing as Prentice Hall
Star vs Snowflake Schema
1-38
Copyright © 2011 Pearson Education, Inc. Publishing as Prentice Hall
Analysis of Data in DW
Online analytical processing (OLAP)
OLAP Activities
1-39
Data driven activities performed by end s to query the online system and to conduct analyses Data cubes, drill-down / rollup, slice & dice, … Generating queries (query tools) Requesting ad hoc reports Conducting statistical and other analyses Developing multimedia-based applications
Copyright © 2011 Pearson Education, Inc. Publishing as Prentice Hall
Analysis of Data Stored in DW OLTP vs. OLAP
OLTP (online transaction processing)
OLAP (online analytic processing)
1-40
A system that is primarily responsible for capturing and storing data related to day-to-day business functions such as ERP, CRM, SCM, POS, The main focus is on efficiency of routine tasks A system is designed to address the need of information extraction by providing effectively and efficiently ad hoc analysis of organizational data The main focus is on effectiveness
Copyright © 2011 Pearson Education, Inc. Publishing as Prentice Hall
OLAP vs. OLTP
1-41
Copyright © 2011 Pearson Education, Inc. Publishing as Prentice Hall
OLAP Operations
1-42
Slice – a subset of a multidimensional array Dice – a slice on more than two dimensions Drill Down/Up – navigating among levels of data ranging from the most summarized (up) to the most detailed (down) Roll Up – computing all of the data relationships for one or more dimensions Pivot – used to change the dimensional orientation of a report or an ad hoc querypage display
Copyright © 2011 Pearson Education, Inc. Publishing as Prentice Hall
e Ti m
Slicing Operations on a Simple TreeDimensional Data Cube
Sales volumes of a specific Product on variable Time and Region
Product Cells are filled with numbers representing sales volumes
Geography
OLAP
A 3-dimensional OLAP cube with slicing operations
Sales volumes of a specific Region on variable Time and Products
Sales volumes of a specific Time on variable Region and Products
1-43
Copyright © 2011 Pearson Education, Inc. Publishing as Prentice Hall
DW Implementation Issues
11 tasks for successful DW implementation
1-44
Establishment of service-level agreements and data-refresh requirements Identification of data sources and their governance policies Data quality planning Data model design ETL tool selection Relational database software and platform selection Data transport Data conversion Reconciliation process Purge and archive planning End-
Copyright © 2011 Pearson Education, Inc. Publishing as Prentice Hall
DW Implementation Guidelines
1-45
Project must fit with corporate strategy & business objectives There must be complete buy-in to the project by executives, managers, and s It is important to manage expectations about the completed project The data warehouse must be built incrementally Build in adaptability, flexibility and scalability The project must be managed by both IT and business professionals Only load data that have been cleansed and are of a quality understood by the organization Do not overlook training requirements Be politically aware
Copyright © 2011 Pearson Education, Inc. Publishing as Prentice Hall
Successful DW Implementation Things to Avoid
1-46
Starting with the wrong sponsorship chain Setting expectations that you cannot meet Engaging in politically naive behavior Loading the data warehouse with information just because it is available Believing that data warehousing database design is the same as transactional database design Choosing a data warehouse manager who is technology oriented rather than oriented
Copyright © 2011 Pearson Education, Inc. Publishing as Prentice Hall
Successful DW Implementation Things to Avoid - Cont.
1-47
Focusing on traditional internal recordoriented data and ignoring the value of external data and of text, images, etc. Delivering data with confusing definitions Believing promises of performance, capacity, and scalability Believing that your problems are over when the data warehouse is up and running Focusing on ad hoc data mining and periodic reporting instead of alerts
Copyright © 2011 Pearson Education, Inc. Publishing as Prentice Hall
Failure Factors in DW Projects
Lack of executive sponsorship Unclear business objectives Cultural issues being ignored
1-48
Change management
Unrealistic expectations Inappropriate architecture Low data quality / missing information Loading data just because it is available
Copyright © 2011 Pearson Education, Inc. Publishing as Prentice Hall
Real-time/Active DW/BI
Enabling real-time data updates for real-time analysis and real-time decision making is growing rapidly
Concerns about real-time BI
1-49
Push vs. Pull (of data) Not all data should be updated continuously Mismatch of reports generated minutes apart May be cost prohibitive May also be infeasible
Copyright © 2011 Pearson Education, Inc. Publishing as Prentice Hall
Real-time/Active DW at Teradata
1-50
Copyright © 2011 Pearson Education, Inc. Publishing as Prentice Hall
Enterprise Decision Evolution and DW
1-51
Copyright © 2011 Pearson Education, Inc. Publishing as Prentice Hall
The Future of DW
Sourcing…
Infrastructure…
1-52
Open source software SaaS (software as a service) Cloud computing DW appliances Real-time DW Data management practices/technologies In-memory processing (“super-computing”) New DBMS Advanced analytics
Copyright © 2011 Pearson Education, Inc. Publishing as Prentice Hall
BI / OLAP Portal for Learning
1-53
MicroStrategy, and much more… www.TeradataStudentNetwork.com Pw:
Copyright © 2011 Pearson Education, Inc. Publishing as Prentice Hall
Business Intelligence: A Managerial Approach nd (2 Edition) Chapter 3: Business Performance Management (BPM)
Business Performance Management (BPM) Overview
1-55
Business Performance Management (BPM) is… A real-time system that alert managers to potential opportunities, impending problems, and threats, and then empowers them to react through models and collaboration. Also called, corporate performance management (M by Gartner Group), enterprise performance management (EPM by Oracle), strategic enterprise management (SEM by SAP)
Copyright © 2011 Pearson Education, Inc. Publishing as Prentice Hall
Business Performance Management (BPM) Overview
BPM refers to the business processes, methodologies, metrics, and technologies used by enterprises to measure, monitor, and manage business performance. BPM encomes three key components
1-56
A set of integrated, closed-loop management and analytic processes, ed by technology Tools for businesses to define strategic goals and then measure/manage performance against them Methods and tools for monitoring key performance indicators (KPIs), linked to organizational strategy
Copyright © 2011 Pearson Education, Inc. Publishing as Prentice Hall
BPM versus BI
BPM is an outgrowth of BI and incorporates many of its technologies, applications, and techniques.
1-57
The same companies market and sell them. BI has evolved so that many of the original differences between the two no longer exist (e.g., BI used to be focused on departmental rather than enterprise-wide projects). BI is a crucial element of BPM.
BPM = BI + Planning (a unified solution)
Copyright © 2011 Pearson Education, Inc. Publishing as Prentice Hall
A Closed-loop Process to Optimize Business Performance
Process Steps 1. 2. 3. 4.
Strategize Plan Monitor/analyze Act/adjust
Each with its own process steps… 1-58
Copyright © 2011 Pearson Education, Inc. Publishing as Prentice Hall
Strategize: Where Do We Want to Go?
1-59
Strategic objective A broad statement or general course of action prescribing targeted directions for an organization Strategic goal A quantified objective with a designated time period Strategic vision A picture or mental image of what the organization should look like in the future Critical success factors (CSF) Key factors that delineate the things that an organization must excel at to be successful
Copyright © 2011 Pearson Education, Inc. Publishing as Prentice Hall
Strategize: Where Do We Want to Go? “90 percent of organizations fail to execute their strategies” The strategy gap
Four sources for the gap between strategy and execution: 1. 2. 3. 4.
1-60
Communication (enterprise-wide) Alignment of rewards and incentives Focus (concentrating on the core elements) Resources
Copyright © 2011 Pearson Education, Inc. Publishing as Prentice Hall
Plan: How Do We Get There?
Operational planning
Operational plan: plan that translates an organization’s strategic objectives and goals into a set of well-defined tactics and initiatives, resources requirements, and expected results for some future time period (usually a year).
Operational planning can be
1-61
Tactic-centric (operationally focused) Budget-centric (financially focused)
Copyright © 2011 Pearson Education, Inc. Publishing as Prentice Hall
Plan: How Do We Get There?
Financial planning and budgeting
1-62
An organization’s strategic objectives and key metrics should serve as top-down drivers for the allocation of an organization’s tangible and intangible assets Resource allocations should be carefully aligned with the organization’s strategic objectives and tactics in order to achieve strategic success
Copyright © 2011 Pearson Education, Inc. Publishing as Prentice Hall
Monitor: How Are We Doing?
A comprehensive framework for monitoring performance should address two key issues:
What to monitor
1-63
Critical success factors Strategic goals and targets
How to monitor
Copyright © 2011 Pearson Education, Inc. Publishing as Prentice Hall
Monitor: How Are We Doing?
Diagnostic control system A cybernetic system that has inputs, a process for transforming the inputs into outputs, a standard or benchmark against which to compare the outputs, and a channel to allow information on variances between the outputs and the standard to be communicated and acted upon
1-64
Copyright © 2011 Pearson Education, Inc. Publishing as Prentice Hall
Monitor: How Are We Doing?
Pitfalls of variance analysis
1-65
The vast majority of the exception analysis focuses on negative variances when functional groups or departments fail to meet their targets Rarely are positive variances reviewed for potential opportunities, and rarely does the analysis focus on assumptions underlying the variance patterns
Copyright © 2011 Pearson Education, Inc. Publishing as Prentice Hall
Monitor: How Are We Doing?
What if strategic assumptions (not the operations) are wrong?
1-66
Copyright © 2011 Pearson Education, Inc. Publishing as Prentice Hall
Act and Adjust: What Do We Need to Do Differently? Harrah’s Closed-Loop Marketing Model
1-67
Copyright © 2011 Pearson Education, Inc. Publishing as Prentice Hall
Performance Measurement
Performance measurement system A system that assists managers in tracking the implementations of business strategy by comparing actual results against strategic goals and objectives
1-68
Comprises systematic comparative methods that indicate progress (or lack thereof) against goals
Copyright © 2011 Pearson Education, Inc. Publishing as Prentice Hall
Performance Measurement KPIs and Operational Metrics
Key performance indicator (KPI) A KPI represents a strategic objective and metric that measures performance against a goal Distinguishing features of KPIs
1-69
Strategy Targets Ranges
Encodings Time frames Benchmarks
Copyright © 2011 Pearson Education, Inc. Publishing as Prentice Hall
Performance Measurement
Key performance indicator (KPI) Outcome KPIs vs. (lagging indicators e.g., revenues)
Operational areas covered by driver KPIs
1-70
Driver KPIs (leading indicators e.g., sales leads)
Customer performance Service performance Sales operations Sales plan/forecast
Copyright © 2011 Pearson Education, Inc. Publishing as Prentice Hall
Performance Measurement
The drawbacks of using financial data as the core of a performance measurement:
1-71
Financial measures are usually reported by organizational structures and not by the processes that produced them Financial measures are lagging indicators, telling us what happened, not why it happened or what is likely to happen in the future Financial measures are often the product of allocations that are not related to the underlying processes that generated them Financial measures are focused on the short term returns
Copyright © 2011 Pearson Education, Inc. Publishing as Prentice Hall
Performance Measurement
Good performance measures should:
1-72
Be focused on key factors. Be a mix of past, present, and future. Balance the needs of all stakeholders (shareholders, employees, partners, suppliers, etc.). Start at the top and trickle down to the bottom. Have targets that are based on research and reality rather than be arbitrary.
Copyright © 2011 Pearson Education, Inc. Publishing as Prentice Hall
BPM Methodologies
1-73
Balanced scorecard (BSC) A performance measurement and management methodology that helps translate an organization’s financials, customer, internal process, and learning and growth objectives and targets into a set of actionable initiatives "The Balanced Scorecard: Measures (HBR, 1992) That Drive Performance”
Copyright © 2011 Pearson Education, Inc. Publishing as Prentice Hall
BPM Methodologies Balanced Scorecard
1-74
Copyright © 2011 Pearson Education, Inc. Publishing as Prentice Hall
BPM Methodologies
In BSC, the term “balance” arises because the combined set of measures are supposed to encom indicators that are:
1-75
Financial and nonfinancial Leading and lagging Internal and external Quantitative and qualitative Short term and long term
Copyright © 2011 Pearson Education, Inc. Publishing as Prentice Hall
BPM Methodologies
Aligning strategies and actions A six-step process 1. 2. 3. 4. 5. 6.
1-76
Developing and formulating a strategy Planning the strategy Aligning the organization Planning the operations Monitoring and learning Testing and adapting the strategy
Copyright © 2011 Pearson Education, Inc. Publishing as Prentice Hall
BPM Methodologies
1-77
Six Sigma A performance management methodology aimed at reducing the number of defects in a business process to as close to zero defects per million opportunities (DPMO) as possible
Copyright © 2011 Pearson Education, Inc. Publishing as Prentice Hall
BPM Methodologies How to Succeed in Six Sigma
1-78
Six Sigma is integrated with business strategy Six Sigma s business objectives Key executives are engaged in the process Project selection is based on value potential There is a critical mass of projects and resources Projects-in-process are actively managed Team leadership skills are emphasized Results are rigorously tracked
BSC + Six Sigma = Success (see Tech. Ins. 9.3)
Copyright © 2011 Pearson Education, Inc. Publishing as Prentice Hall
BPM Architecture and Applications
BPM applications 1. 2. 3. 4. 5.
1-79
Strategy management Budgeting, planning, and forecasting Financial consolidation Profitability modeling and optimization Financial, statutory, and management reporting
Copyright © 2011 Pearson Education, Inc. Publishing as Prentice Hall
Performance Dashboards
1-80
Dashboards and scorecards both provide visual displays of important information that is consolidated and arranged on a single screen so that information can be digested at a single glance and easily explored
Copyright © 2011 Pearson Education, Inc. Publishing as Prentice Hall
Performance Dashboards
1-81
Copyright © 2011 Pearson Education, Inc. Publishing as Prentice Hall
Performance Dashboards
Dashboards versus scorecards
1-82
Performance dashboards Visual display used to monitor operational performance (free form) Performance scorecards Visual display used to chart progress against strategic and tactical goals and targets (predetermined measures)
Copyright © 2011 Pearson Education, Inc. Publishing as Prentice Hall
Performance Dashboards
Dashboards versus scorecards
Performance dashboard is a multilayered application built on a business intelligence and data integration infrastructure that enables organizations to measure, monitor, and manage business performance more effectively - Eckerson
Three types of performance dashboards: 1. 2. 3.
1-83
Operational dashboards Tactical dashboards Strategic dashboards
Copyright © 2011 Pearson Education, Inc. Publishing as Prentice Hall
Performance Dashboards
Dashboard design
1-84
“The fundamental challenge of dashboard design is to display all the required information on a single screen, clearly and without distraction, in a manner that can be assimilated quickly" (Few, 2005)
Copyright © 2011 Pearson Education, Inc. Publishing as Prentice Hall
Business Intelligence: A Managerial Approach nd (2 Edition) Chapter 4: Data Mining for Business Intelligence
Data Mining Concepts and Definitions Why Data Mining?
1-86
More intense competition at the global scale Recognition of the value in data sources Availability of quality data on customers, vendors, transactions, Web, etc. Consolidation and integration of data repositories into data warehouses The exponential increase in data processing and storage capabilities; and decrease in cost Movement toward conversion of information resources into nonphysical form
Copyright © 2011 Pearson Education, Inc. Publishing as Prentice Hall
Definition of Data Mining
1-87
The nontrivial process of identifying valid, novel, potentially useful, and ultimately understandable patterns in data stored in structured databases - Fayyad et al., (1996) Keywords in this definition: Process, nontrivial, valid, novel, potentially useful, understandable Data mining: a misnomer? Other names: knowledge extraction, pattern analysis, knowledge discovery, information harvesting, pattern searching, data dredging
Copyright © 2011 Pearson Education, Inc. Publishing as Prentice Hall
Data Mining Characteristics/Objectives
1-88
Source of data for DM is often a consolidated data warehouse (not always!). DM environment is usually a client-server or a Web-based information systems architecture. Data is the most critical ingredient for DM which may include soft/unstructured data. The miner is often an end . Striking it rich requires creative thinking. Data mining tools’ capabilities and ease of use are essential (Web, Parallel processing, etc.).
Copyright © 2011 Pearson Education, Inc. Publishing as Prentice Hall
Data in Data Mining
Data: a collection of facts usually obtained as the result of experiences, observations, or experiments Data may consist of numbers, words, and images Data: lowest level of abstraction (from which information and knowledge are derived) - DM with different data types? - Other data types?
1-89
Copyright © 2011 Pearson Education, Inc. Publishing as Prentice Hall
What Does DM Do? How Does it Work?
DM extracts patterns from data
Types of patterns
1-90
Pattern? A mathematical (numeric and/or symbolic) relationship among data items Association Prediction Cluster (segmentation) Sequential (or time series) relationships
Copyright © 2011 Pearson Education, Inc. Publishing as Prentice Hall
A Taxonomy for Data Mining Tasks
1-91
Copyright © 2011 Pearson Education, Inc. Publishing as Prentice Hall
Data Mining Applications
Customer Relationship Management
Banking & Other Financial
1-92
Maximize return on marketing campaigns Improve customer retention (churn analysis) Maximize customer value (cross- or up-selling) Identify and treat most valued customers
Automate the loan application process Detecting fraudulent transactions Maximize customer value (cross- and up-selling) Optimizing cash reserves with forecasting
Copyright © 2011 Pearson Education, Inc. Publishing as Prentice Hall
Data Mining Applications (cont.)
Retailing and Logistics
Manufacturing and Maintenance
1-93
Optimize inventory levels at different locations Improve the store layout and sales promotions Optimize logistics by predicting seasonal effects Minimize losses due to limited shelf life
Predict/prevent machinery failures Identify anomalies in production systems to optimize manufacturing capacity Discover novel patterns to improve product quality
Copyright © 2011 Pearson Education, Inc. Publishing as Prentice Hall
Data Mining Applications (cont.)
Brokerage and Securities Trading
Insurance
1-94
Predict changes on certain bond prices Forecast the direction of stock fluctuations Assess the effect of events on market movements Identify and prevent fraudulent activities in trading
Forecast claim costs for better business planning Determine optimal rate plans Optimize marketing to specific customers Identify and prevent fraudulent claim activities
Copyright © 2011 Pearson Education, Inc. Publishing as Prentice Hall
Data Mining Applications (cont.) 1-95
Computer hardware and software Science and engineering Government and defense Homeland security and law enforcement Travel industry Healthcare Highly popular application areas for data mining Medicine Entertainment industry Sports Etc.
Copyright © 2011 Pearson Education, Inc. Publishing as Prentice Hall
Data Mining Process: CRISP-DM
1-96
Copyright © 2011 Pearson Education, Inc. Publishing as Prentice Hall
Data Mining Process: CRISP-DM Step Step Step Step Step Step
1-97
1: 2: 3: 4: 5: 6:
Business Understanding Data Understanding Data Preparation (!) Model Building Testing and Evaluation Deployment
s for ~85% of total project time
The process is highly repetitive and experimental (DM: art versus science?)
Copyright © 2011 Pearson Education, Inc. Publishing as Prentice Hall
Data Preparation – A Critical DM Task
1-98
Copyright © 2011 Pearson Education, Inc. Publishing as Prentice Hall
Data Mining Process: SEMMA
1-99
Copyright © 2011 Pearson Education, Inc. Publishing as Prentice Hall
Data Mining Methods: Classification
1-100
Most frequently used DM method Part of the machine-learning family Employ supervised learning Learn from past data, classify new data The output variable is categorical (nominal or ordinal) in nature Classification versus regression? Classification versus clustering?
Copyright © 2011 Pearson Education, Inc. Publishing as Prentice Hall
Classification Techniques 1-101
Decision tree analysis Statistical analysis Neural networks vector machines Case-based reasoning Bayesian classifiers Genetic algorithms Rough sets
Copyright © 2011 Pearson Education, Inc. Publishing as Prentice Hall
Decision Trees
A general algorithm for decision tree building
Employs the divide and conquer method Recursively divides a training set until each division consists of examples from one class 1. 2. 3.
4.
1-102
Create a root node and assign all of the training data to it. Select the best splitting attribute. Add a branch to the root node for each value of the split. Split the data into mutually exclusive subsets along the lines of the specific split. Repeat the steps 2 and 3 for each and every leaf node until the stopping criteria is reached.
Copyright © 2011 Pearson Education, Inc. Publishing as Prentice Hall
Cluster Analysis for Data Mining
1-103
Used for automatic identification of natural groupings of things Part of the machine-learning family Employ unsupervised learning Learns the clusters of things from past data, then assigns new instances There is no output variable Also known as segmentation
Copyright © 2011 Pearson Education, Inc. Publishing as Prentice Hall
Cluster Analysis for Data Mining
Clustering results may be used to
1-104
Identify natural groupings of customers Identify rules for asg new cases to classes for targeting/diagnostic purposes Provide characterization, definition, labeling of populations Decrease the size and complexity of problems for other data mining methods Identify outliers in a specific domain (e.g., rare-event detection)
Copyright © 2011 Pearson Education, Inc. Publishing as Prentice Hall
Cluster Analysis for Data Mining
k-Means Clustering Algorithm
k : pre-determined number of clusters
Algorithm (Step 0: determine value of k)
Step 1: Randomly generate k random points as initial cluster centers. Step 2: Assign each point to the nearest cluster center. Step 3: Re-compute the new cluster centers. Repeat steps 3 and 4 until some convergence criterion is met (usually that the assignment of points to clusters becomes stable). 1-105
Copyright © 2011 Pearson Education, Inc. Publishing as Prentice Hall
Cluster Analysis for Data Mining k-Means Clustering Algorithm
1-106
Copyright © 2011 Pearson Education, Inc. Publishing as Prentice Hall
Association Rule Mining
1-107
A very popular DM method in business Finds interesting relationships (affinities) between variables (items or events) Part of machine learning family Employs unsupervised learning There is no output variable Also known as market basket analysis Often used as an example to describe DM to ordinary people, such as the famous “relationship between diapers and beers!”
Copyright © 2011 Pearson Education, Inc. Publishing as Prentice Hall
Association Rule Mining
Input: the simple point-of-sale transaction data Output: Most frequent affinities among items Example: according to the transaction data… “Customer who bought a laptop computer and a virus protection software, also bought extended service plan 70 percent of the time" How do you use such a pattern/knowledge?
1-108
Put the items next to each other for ease of finding Promote the items as a package (do not put one on sale if the other(s) are on sale) Place items far apart from each other so that the customer has to walk the aisles to search for it, and by doing so potentially see and buy other items
Copyright © 2011 Pearson Education, Inc. Publishing as Prentice Hall
Association Rule Mining
Representative applications of association rule mining include
1-109
In business: cross-marketing, cross-selling, store design, catalog design, e-commerce site design, optimization of online advertising, product pricing, and sales/promotion configuration In medicine: relationships between symptoms and illnesses; diagnosis and patient characteristics and treatments (to be used in medical DSS); and genes and their functions (to be used in genomics projects)
Copyright © 2011 Pearson Education, Inc. Publishing as Prentice Hall
Artificial Neural Networks for Data Mining
Artificial neural networks (ANN or NN) is a brain metaphor for information processing a.k.a. Neural Computing Very good at capturing highly complex non-linear functions! Many uses – prediction (regression, classification),
clustering/segmentation
Many application areas – finance, medicine,
marketing, manufacturing, service operations, information systems, etc. 1-110
Copyright © 2011 Pearson Education, Inc. Publishing as Prentice Hall
Biological NN
Dendrites
Synapse
Synapse
Axon Axon
Biological versus Artificial Neural Networks
Artificial NN
x1
Y1
w1 Inputs Outputs
x2
w2
Processing Element (PE)
S Weights
f (S )
n
i 1
X iW
i
Y
Transfer Function
Summation
xn
1-111
Neuron
Dendrites
Neuron
wn
Biological
Neuron Dendrites Axon Synapse Slow Copyright © 2011 Pearson Education, Inc. Publishing as Prentice Hall Many (109)
Artificial Node (or PE) Input Output Weight Fast Few (102)
Y2 . . . Yn
Data Mining Myths
Data mining …
1-112
provides instant solutions/predictions. is not yet viable for business applications. requires a separate, dedicated database. can only be done by those with advanced degrees. is only for large firms that have lots of customer data. is another name for good-old statistics.
Copyright © 2011 Pearson Education, Inc. Publishing as Prentice Hall
Common Data Mining Blunders 1. 2. 3. 4. 5.
1-113
Selecting the wrong problem for data mining Ignoring what your sponsor thinks data mining is and what it really can/cannot do Not leaving sufficient time for data acquisition, selection and preparation Looking only at aggregated results and not at individual records/predictions Being sloppy about keeping track of the data mining procedure and results
Copyright © 2011 Pearson Education, Inc. Publishing as Prentice Hall
Common Data Mining Mistakes 6. 7. 8. 9. 10. 1-114
Ignoring suspicious (good or bad) findings and quickly moving on Running mining algorithms repeatedly and blindly, without thinking about the next stage Naively believing everything you are told about the data Naively believing everything you are told about your own data mining analysis Measuring your results differently from the way your sponsor measures them
Copyright © 2011 Pearson Education, Inc. Publishing as Prentice Hall
Business Intelligence: A Managerial Approach nd (2 Edition) Chapter 5: Text and Web Mining
Text Mining Concepts
85-90 percent of all corporate data is in some kind of unstructured form (e.g., text). Unstructured corporate data is doubling in size every 18 months. Tapping into these information sources is not an option, but a need to stay competitive. Answer: text mining
1-116
A semi-automated process of extracting knowledge from unstructured data sources a.k.a. text data mining or knowledge discovery in textual databases
Copyright © 2011 Pearson Education, Inc. Publishing as Prentice Hall
Data Mining versus Text Mining
Both seek novel and useful patterns Both are semi-automated processes Difference is the nature of the data:
1-117
Structured versus unstructured data Structured data: databases Unstructured data: Word documents, PDF files, text excerpts, XML files, and so on
Text mining – first, impose structure to the data, then mine the structured data
Copyright © 2011 Pearson Education, Inc. Publishing as Prentice Hall
Text Mining Concepts
Benefits of text mining are obvious especially in text-rich data environments
Electronic communication records (e.g., Email)
1-118
e.g., law (court orders), academic research (research articles), finance (quarterly reports), medicine (discharge summaries), biology (molecular interactions), technology (patent files), marketing (customer comments), etc. Spam filtering Email prioritization and categorization Automatic response generation
Copyright © 2011 Pearson Education, Inc. Publishing as Prentice Hall
Text Mining Application Area
1-119
Information extraction Topic tracking Summarization Categorization Clustering Concept linking Question answering
Copyright © 2011 Pearson Education, Inc. Publishing as Prentice Hall
Text Mining Terminology 1-120
Unstructured or semistructured data Corpus (and corpora) Concepts Stemming Stop words (and include words) Synonyms (and polysemes) Tokenizing
Copyright © 2011 Pearson Education, Inc. Publishing as Prentice Hall
Text Mining Terminology
Term dictionary Word frequency Part-of-speech tagging Morphology Term-by-document matrix
Singular value decomposition
1-121
Occurrence matrix Latent semantic indexing
Copyright © 2011 Pearson Education, Inc. Publishing as Prentice Hall
Natural Language Processing (NLP)
Structuring a collection of text
NLP is
1-122
Old approach: bag-of-words New approach: natural language processing a very important concept in text mining. a subfield of artificial intelligence and computational linguistics. the study of "understanding" the natural human language.
Syntax versus semantics based text mining
Copyright © 2011 Pearson Education, Inc. Publishing as Prentice Hall
Natural Language Processing (NLP)
What is “Understanding” ?
1-123
Human understands, what about computers? Natural language is vague, context driven True understanding requires extensive knowledge of a topic Can/will computers ever understand natural language the same/accurate way we do?
Copyright © 2011 Pearson Education, Inc. Publishing as Prentice Hall
Natural Language Processing (NLP)
Challenges in NLP
Dream of AI community
1-124
Part-of-speech tagging Text segmentation Word sense disambiguation Syntax ambiguity Imperfect or irregular input Speech acts
to have algorithms that are capable of automatically reading and obtaining knowledge from text
Copyright © 2011 Pearson Education, Inc. Publishing as Prentice Hall
NLP Task Categories 1-125
Information retrieval Information extraction Named-entity recognition Question answering Automatic summarization Natural language generation & understanding Machine translation Foreign language reading & writing Speech recognition Text proofing Optical character recognition
Copyright © 2011 Pearson Education, Inc. Publishing as Prentice Hall
Text Mining Applications
Marketing applications
Enables better CRM
Security applications
ECHELON, OASIS Deception detection
Medicine and biology
Literature-based gene identification
example coming up
Academic applications
1-126
example coming up
Research stream analysis
- example coming up
Copyright © 2011 Pearson Education, Inc. Publishing as Prentice Hall
Text Mining Applications
1-127
Application Case 7.4: Mining for Lies
Copyright © 2011 Pearson Education, Inc. Publishing as Prentice Hall
Text Mining Applications
1-128
Application Case 7.4: Mining for Lies Category
Example Cues
Quantity
Verb count, noun-phrase count, ...
Complexity
Avg. no of clauses, sentence length, …
Uncertainty
Modifiers, modal verbs, ...
Nonimmediacy
ive voice, objectification, ...
Expressivity
Emotiveness
Diversity
Lexical diversity, redundancy, ...
Informality
Typographical error ratio
Specificity
Spatiotemporal, perceptual information …
Affect
Positive affect, negative affect, etc.
Copyright © 2011 Pearson Education, Inc. Publishing as Prentice Hall
Text Mining Process
The three-step text mining process 1-129
Copyright © 2011 Pearson Education, Inc. Publishing as Prentice Hall
Text Mining Process
Step 1: Establish the corpus
1-130
Collect all relevant unstructured data (e.g., textual documents, XML files, emails, Web pages, short notes, voice recordings…) Digitize, standardize the collection (e.g., all in ASCII text files) Place the collection in a common place (e.g., in a flat file, or in a directory as separate files)
Copyright © 2011 Pearson Education, Inc. Publishing as Prentice Hall
Text Mining Process
1-131
Step 2: Create the Term–by–Document Matrix
Copyright © 2011 Pearson Education, Inc. Publishing as Prentice Hall
Text Mining Process
Step 2: Create the Term–by–Document Matrix (TDM)
Should all be included?
What is the best representation of the indices (values in cells)?
1-132
Stop words, include words Synonyms, homonyms Stemming
Row counts; binary frequencies; log frequencies; Inverse document frequency
Copyright © 2011 Pearson Education, Inc. Publishing as Prentice Hall
Web Mining Overview
Web is the largest repository of data Data is in HTML, XML, text format Challenges (of processing Web data)
1-133
The The The The The
Web Web Web Web Web
is too big for effective data mining is too complex is too dynamic is not specific to a domain has everything
Opportunities and challenges are great!
Copyright © 2011 Pearson Education, Inc. Publishing as Prentice Hall
Web Mining
1-134
Web mining (or Web data mining) is the process of discovering intrinsic relationships from Web data (textual, linkage, or usage)
Copyright © 2011 Pearson Education, Inc. Publishing as Prentice Hall
Web Content/Structure Mining
Mining of the textual content on the Web Data collection via Web crawlers
Web pages include hyperlinks
1-135
Authoritative pages Hubs hyperlink-induced topic search (HITS) alg.
Copyright © 2011 Pearson Education, Inc. Publishing as Prentice Hall
Web Usage Mining
Extraction of information from data generated through Web page visits and transactions
1-136
data stored in server access logs, referrer logs, agent logs, and client-side cookies characteristics and usage profiles metadata, such as page attributes, content attributes, and usage data
Clickstream data Clickstream analysis
Copyright © 2011 Pearson Education, Inc. Publishing as Prentice Hall
Web Usage Mining
Web usage mining applications
1-137
Determine the lifetime value of clients Design cross-marketing strategies across products. Evaluate promotional campaigns Target electronic ads and coupons at groups based on access patterns Predict behavior based on previously learned rules and s' profiles Present dynamic information to s based on their interests and profiles
Copyright © 2011 Pearson Education, Inc. Publishing as Prentice Hall
Web Usage Mining
(clickstream analysis)
1-138
Copyright © 2011 Pearson Education, Inc. Publishing as Prentice Hall
Web Mining Success Stories
1-139
Amazon.com, Ask.com, Scholastic.com, etc. Website Optimization Ecosystem
Copyright © 2011 Pearson Education, Inc. Publishing as Prentice Hall
Business Intelligence: A Managerial Approach nd (2 Edition) Chapter 6: BI Implementation: Integration and Emerging Trends
Implementing BI – An Overview
Critical Success Factors for BI Implementation a. b. c. d. e. f. g.
1-141
Business driven methodology and project management Clear vision and planning Committed management and sponsorship Data management and quality issues Mapping the solutions to the requirements Performance considerations of the BI system Robust and extensible framework
Copyright © 2011 Pearson Education, Inc. Publishing as Prentice Hall
Managerial Issues Related to BI Implementation 1. 2. 3. 4. 5. 6. 7. 8. 1-142
System development and the need for integration Cost–benefit issues and justification Legal issues and privacy BI and BPM today and tomorrow Cost justification; intangible benefits Documenting and securing systems Ethical issues BI Project failures
Copyright © 2011 Pearson Education, Inc. Publishing as Prentice Hall
BI and Integration Implementation
Why integrate?
1-143
To better implement a complete BI system To increase the capabilities of the BI applications To enable real-time decision To enable more powerful applications To facilitate faster system development To enhance activities such as blogs, wikis, RSS feeds, etc.
Copyright © 2011 Pearson Education, Inc. Publishing as Prentice Hall
BI and Integration Implementation
Levels of BI Integration
Functional integration can be within the same BI or across different BI systems
Embedded Intelligent Systems
1-144
Integration across different BI systems can be accomplished in a loosely coupled fashion – input output ing, messaging (SOA) Integration within a BI system is more cohesive with several sub-systems constituting the whole
Serving as the intelligent agents within BI
Copyright © 2011 Pearson Education, Inc. Publishing as Prentice Hall
Connecting BI Systems to Databases and Other Enterprise Systems
Virtually every BI application requires database or data warehouse access
Multi-tiered Application Architecture 1-145
Copyright © 2011 Pearson Education, Inc. Publishing as Prentice Hall
On-Demand BI
The limitations of Traditional BI
Complex, time-consuming, expensive
The On-Demand Alternative
On-demand computing = Utility computing SaaS (Software as a service) Allows SMEs to utilize affordable BI On-demand function alternatives
1-146
Internally sharing licenses within a firm Sharing licenses with many firms via an ASP
Copyright © 2011 Pearson Education, Inc. Publishing as Prentice Hall
Benefits of On-Demand BI
Ability to handle fluctuating demand
Reduced investment/cost
1-147
Flexible use of the BI technology pool Hardware (servers and peripherals) Software (more features for less) Maintenance (centralized timely updates)
Embodiment of recognized best practices Better flexibility and connectivity with other systems via SaaS infrastructure Better RIO
Copyright © 2011 Pearson Education, Inc. Publishing as Prentice Hall
The Limitations of On-Demand BI
1-148
Integration of vendors’ software with company’s software may be difficult The vendor can go out of business, leaving the company without a service It is difficult or even impossible to modify hosted software for better fit with the s’ needs Upgrading may become a problem You may relinquish strategic data to strangers (lack of privacy/security of corporate data)
Copyright © 2011 Pearson Education, Inc. Publishing as Prentice Hall
Issues of Legality, Privacy and Ethics
Ethics in Decision Making and
1-149
Electronic surveillance Software piracy Use of proprietary databases Use of intellectual property such as knowledge Computer accessibility for workers with disabilities Accuracy of data, information, and knowledge Protection of the rights of s
Use of corporate computers for non-workrelated purposes (personal use of Internet while working)
Copyright © 2011 Pearson Education, Inc. Publishing as Prentice Hall
Emerging Topics in BI – An Overview
1-150
Web 2.0 revolution as it relates to BI in (Section 6.7) Online social networks (Section 6.8) Virtual worlds as related to BI (Section 6.9) Integration social networking and BI (Section 6.10) RFID and BI (Section 6.11) Reality Mining (Section 6.12)
Copyright © 2011 Pearson Education, Inc. Publishing as Prentice Hall
Emerging Topics in BI – An Overview The Future of BI
1-151
Web 2.0 revolution as it related to BI (Section 6.7) Online social networks (Section 6.8) Virtual worlds as related to BI (Section 6.9) Integration social networking and BI (Section 6.10) RFID and BI (Section 6.11) Reality Mining (Section 6.12)
Copyright © 2011 Pearson Education, Inc. Publishing as Prentice Hall
Emerging Topics in BI – An Overview
1-152
In 2009, collaborative decision making emerged as a new product category that combines social software with business intelligence platform capabilities. In 2010, 20 percent of organizations will have an industryspecific analytic application delivered via software as a service as a standard component of their business intelligence portfolio. By 2012, business units will control at least 40 percent of the total budget for BI. By 2012, one-third of analytic applications applied to business processes will be delivered through coarse-grained application mashups. Because of lack of information, processes, and tools, through 2012, more than 35 percent of the top 5,000 global companies will regularly fail to make insightful decisions about significant changes in their business and markets.
Copyright © 2011 Pearson Education, Inc. Publishing as Prentice Hall
The Web 2.0 Revolution
1-153
Web 2.0: a popular term for describing advanced Web technologies and applications, including blogs, wikis, RSS, mashups, generated content, and social networks Objective: enhance creativity, information sharing, and collaboration Difference between Web 2.0 and Web 1.x Use of Web for collaboration among Internet s and other s, content providers, and enterprises
Copyright © 2011 Pearson Education, Inc. Publishing as Prentice Hall
The Web 2.0 Revolution
1-154
Web 2.0: an umbrella term for new technologies for both content as well as how the Web works Web 2.0 has led to the evolution of Web-based virtual communities and their hosting services, such as social networking sites, video-sharing sites Companies that understand these new applications and technologies—and apply the capabilities early on—stand to greatly improve internal business processes and marketing
Copyright © 2011 Pearson Education, Inc. Publishing as Prentice Hall
Online Social Networking – Basics and Examples
A social network is a place where people create their own space, or homepage, on which they write blogs; post pictures, videos, or music; share ideas; and link to other Web locations they find interesting.
The mass adoption of social networking Web sites points to an evolution in human social interaction
The size of social network sites are growing rapidly, with some having over 100 million – growth for successful ones 40 to 50 % in the first few years and 15 to 25 % thereafter
1-155
Copyright © 2011 Pearson Education, Inc. Publishing as Prentice Hall
Mobile Social Networking
Social networking where converse and connect with one another using cell phones or other mobile devices MySpace and Facebook offer mobile services Mobile only services: Brightkite, and Fon11 Basic types of mobile social networks 1. 2.
1-156
Partnership with mobile carriers (use of MySpace over AT&T network) Without a partnership (“off deck”) (e.g., MocoSpace and Mobikade)
Mobile Enterprise Networks Mobile Community Activities (e.g., Sonopia)
Copyright © 2011 Pearson Education, Inc. Publishing as Prentice Hall
Major Social Network Services
Facebook: The Network Effect
1-157
Launched in 2004 by Mark Zuckerberg (former Harvard student) It is the largest social network service in the world with over 500 million active s worldwide Initially intended for college and high school students to connected to other students at the same school In 2006 opened its doors to anyone over 13; enabling Facebook to compete directly with MySpace.
Copyright © 2011 Pearson Education, Inc. Publishing as Prentice Hall
Implications of Business and Enterprise Social Networks
Business oriented social networks can go beyond “advertising and sales” Emerging enterprise social networking apps:
Finding and Recruiting Workers
Management Activities and Training Knowledge Management and Expert Location
1-158
See Application Case 14.2 for a representative example
e.g., innocentive.com; awareness.com; Caterpillar
Enhancing Collaboration Using Blogs and Wikis Within the Enterprise …>
Copyright © 2011 Pearson Education, Inc. Publishing as Prentice Hall
Implications of Business and Enterprise Social Networks
Survey shows that best-in-class companies use blogs and wikis for the following applications:
1-159
Project collaboration and communication (63%) Process and procedure document (63%) FAQs (61%) E-learning and training (46%) Forums for new ideas (41%) Corporate-specific dynamic glossary and terminology (38%) Collaboration with customers (24%)
Copyright © 2011 Pearson Education, Inc. Publishing as Prentice Hall
Virtual Tradeshows
See iTradeFair.com 1-160
Copyright © 2011 Pearson Education, Inc. Publishing as Prentice Hall
Social Networks and BI: Collaborative Decision Making
Collaborative decision making (CDM) – combines social software and BI
1-161
CDM is a category of decision- system for non-routine, complex decisions that require iterative human interactions. Ad hoc tagging regarding value, relevance, credibility, and decision context can substantially enrich both the decision process and the content that contributes to the decisions. Tying BI to decisions and outcomes that can be measured will enable organizations to better demonstrate the business value of BI.
Copyright © 2011 Pearson Education, Inc. Publishing as Prentice Hall
How CDM Works
1-162
Copyright © 2011 Pearson Education, Inc. Publishing as Prentice Hall
How does RFID work?
RFID system
Tags
1-163
a tag (an electronic chip attached to the product to be identified) an interrogator (i.e., reader) with one or more antennae attached a computer (to manage the reader and store the data captured by the reader) Active tag versus ive tags
Copyright © 2011 Pearson Education, Inc. Publishing as Prentice Hall
RFID for Supply Chain BI
RFID in Retail Systems
Functions in a distribution center
receiving, put-away, picking, and shipping
Sequence of operations at a receiving dock unloading the contents of the trailer 2. verification of the receipt of goods against expected delivery (purchase order) 3. documentation of the discrepancy 4. application of labels to the pallets, cases, items 5. sorting of goods for put-away or cross-dock 1.
1-164
Copyright © 2011 Pearson Education, Inc. Publishing as Prentice Hall
RFID for BI in Supply Chain
Better SC visibility with RFID systems
1-165
Timing/duration of movements between different locations – especially important for products with limited shelf life Better management of out-of-stock items (optimal restocking of store shelves) Help streamline the backroom operations: eliminate unnecessary case cycles, reorders Better analysis of movement timings for more effective and efficient logistics
Copyright © 2011 Pearson Education, Inc. Publishing as Prentice Hall
Reality Mining
Identifying aggregate patterns of human activity trends (see sensenetworks.com by MIT & Columbia University) Many devices send location information
1-166
Cars, buses, taxis, mobile phones, cameras, and personal navigation devices Using technologies such as GPS, WiFi, and cell tower triangulation
Enables tracking of assets, finding nearby services, locating friends/family , …
Copyright © 2011 Pearson Education, Inc. Publishing as Prentice Hall
Reality Mining
Citisense: finding people with similar interests
A map of an area of San Francisco with density designation at place of interests See www.sensenetworks.com/city sense.php for real-time animation of the content. 1-167
Copyright © 2011 Pearson Education, Inc. Publishing as Prentice Hall
Related Documents 2w1qw
Turban Ch1 Ch6 5c5p2b
December 2019 37
Ch1 145x6m
December 2021 0
Turban Legend 1k635e
April 2022 0
Buku Turban 2u388
November 2019 514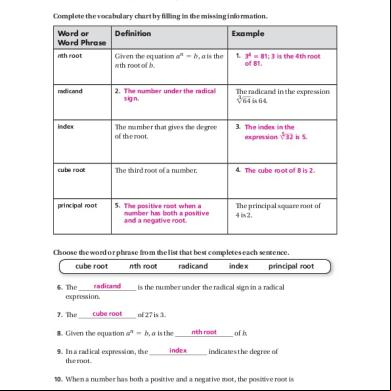
Ch6 Ans 453p12
November 2019 65
Ch6-parallel Io Port 6xh3t
July 2021 0More Documents from "Pramod Khadka" 2k4t3b
Turban Ch1 Ch6 5c5p2b
December 2019 37
The Mahabharata- Book 16 Of 18- Mausala Parva 8253
February 2023 0
Smart Card Hospital Detail 443o5g
December 2019 111
Surpac Structural Suite Part 1 - Key Functions 5d1v43
November 2022 0
Industry Analysis On Ice Cream Industry 254qk
October 2019 100